Maine and Climate Change: The View from Greenland
by Angus King
Let me first begin by discussing why I want to talk about climate change and then I will talk about climate change itself.
I have found from working in public policy now for 20-plus years that it’s relatively easy to find solutions and develop policy if you have a widespread understanding of the facts. If everybody knows the facts, the policy becomes almost self-evident. If you don’t have a shared understanding of the facts, however, getting to a policy resolution is almost impossible. Indeed, one of the problems we face today is that we all get our information from different sources, so we all have different facts. When I was young, we all got our facts from the same person: Walter Cronkite. All Americans learned what they needed to know from Walter Cronkite. Now, we tend to go to the source of information that already confirms what we think, which is called confirmation bias. And the problem with this behavior is that if people have different facts, it’s almost impossible to get to a solution.
Last spring, I met with the commandant of the U.S. Coast Guard, who wanted to talk to me because, given our coastline, the state of Maine interacts a lot with the Coast Guard. While we were meeting, the commandant mentioned that he was going to visit Greenland later in the summer, and while I honestly can’t remember whether he invited me or I invited myself, I ultimately went with him to Greenland in late August. It was an extraordinary trip with a twofold focus: (1) what was happening in Greenland in terms of the climate and (2) national security. I serve on the US Senate Committee on Armed Services and the US Senate Select Committee on Intelligence, so I spend a great deal of my time on national security-related issues. There are huge national security issues in the Arctic. In Greenland, we met with the Danish Joint Arctic Command. (Greenland is an interesting country because although it is mostly independent, Denmark handles Greenland’s international affairs and defense.) We spent a day and a half with staff from the Joint Arctic Command talking about challenges in the Arctic, from issues of national security to search and rescue as the Arctic Ocean opens up.
With us on the trip was Robert Corell, who spends part of his time in Weld, Maine. Bob is a world-renowned climate scientist, particularly when it comes to the Arctic and Antarctic. In fact, he has a region in Antarctica named for him—the Corell Cirque. John Englander, who has written an interesting book called High Tide on Main Street: Rising Sea Level and the Coming Coastal Crisis, was also on the trip.
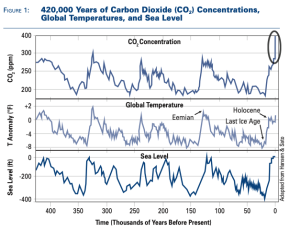
What I want to present here are some firsthand observations about climate change, its implications, where we’re headed, and why we need to do something about this issue. Figure 1 tells you all you need to know about climate change. The top graph in Figure 1 shows 420,000 years of carbon dioxide (CO2) concentrations in the atmosphere, and as you can see, it varies. Sometimes when I talk to people who are skeptical of climate change science they say, “Yeah, look it varies, it goes up and down. It has always done that.” Well, sort of. Carbon dioxide concentrations vary between 180 and approximately 300 parts per million (ppm), but the average is in the range of 250 to 270 ppm. Now, however, CO2 concentrations are 400 ppm. It hasn’t been at 400 ppm for about 5 million years; 400 ppm is uncharted territory. That’s 25 percent higher than the peaks along the graph and almost 100 percent higher than the average. Two years ago, we reached 400 ppm for one month. Last year, I believe we were at 400 ppm for 12 months.
You see that graph and say, “Okay, Angus, CO2 it’s going up, who cares? We breathe it all the time. Plants breathe it in. It’s part of our atmosphere. What’s the problem?”
Here’s the problem. The second graph in Figure 1 shows 420,000 years of temperature data. Notice the similarities between the two graphs: there’s a direct relationship between the two lines in the graphs. In other words, there’s a direct correlation between CO2 and temperature. CO2 goes up, temperature goes up. CO2 goes down, temperature goes down. One of the most interesting things with the pattern visible in these graphs is that you can see CO2 concentrations and temperatures should be starting to go down. We should have been headed into a long, slow cooling, but instead CO2 and temperatures are going up.
Again, so what? It gets a little warmer; we can take our jackets off a little earlier in April. What difference does rising temperature make? Now look at the third graph in Figure 1: sea level. Again, notice the correlation: CO2 goes up, temperature goes up, sea level goes up. Put them all together—and that is about all you need to know in terms of the science of climate change.
An argument you hear is that this fluctuation is just a natural cycle. Well, if it is a natural cycle, it is a curious coincidence that it has happened since we started burning fossil fuels and adding carbon into the atmosphere in a serious way in the last 150 to 200 years. Here’s a way to think about this issue: When we burn coal, oil, or gas, we’re burning carbon that has been stored underground for millions of years. It’s sequestered; it’s locked; it’s not in the atmosphere. The CO2 in the forest, on the other hand, is in the atmosphere. As trees grow, they absorb CO2 from the atmosphere; when they die and rot, the CO2 goes back into the atmosphere. Burning fossil fuels, however, releases new CO2 into the atmosphere.
The levels of CO2 vary between 180 and 300 ppm for 800,000 years, and then suddenly, mysteriously, in 1810, the level starts to rise, and it wasn’t because of volcanoes or storms in the Pacific. That was around the time that we started to burn fossil fuel. From 1750 to 2010, global total annual emissions of CO2 have gone from about 2 million metric tons per year to more than 9,000 million metric tons per year.
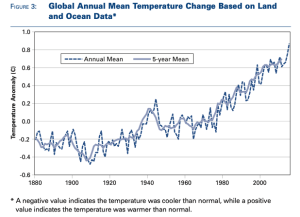
Figure 3 shows mean annual temperatures (using land and ocean data) from 1880 until present. Although there is year-to-year variation, you can see that the trend is going up. One thing you can’t really see from this figure, however, is the acceleration of temperature change. The mean temperature changes gradually during the 1800s and early 1900s, but it is changing more quickly now. We’re talking about accelerating change, and acceleration is an important concept. There are some interesting animations available on the internet that show this acceleration.2
Now again, the question is, why do we care about accelerating temperature changes? There are many reasons to care, actually, but I’m going to focus on sea level.
This was an important understanding I developed on the trip to Greenland. I always think of the ocean as being a fixed asset. You look out at the ocean in Bar Harbor, it’s there, and it’s the way it has always been. There are certain verities, and one of them is the ocean is at the level it has always been. The trouble is that it has only been at this level during the short span of human history—about 8,000 years. That’s a millisecond in geological time. We happened to have settled this country, moved to Maine, and built bridges, roads, and everything else during one of the relatively stable periods of sea level.
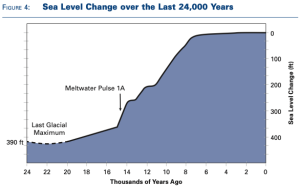
Figure 4 shows something that I found stunning. About 15,000 years ago, the ocean right off of Maine was 300 feet shallower than it is now. I found that an amazing fact: 300 feet, not 3 inches or 30 inches, but 300 feet. Twenty-four thousand years ago, Orono was covered by two miles of ice—10,000 feet of ice. That’s where all the water was. The water was in the glaciers that covered most of North America, which is why the ocean was shallower then. As the glaciers melted, sea level rose.
In Figure 4, from 8,000 years ago to the present looks quite stable, but if you lived during the years represented by the sharply vertical line, you’d ask, “what’s happening?” During this period between 14,000 and 16,000 years ago, called the meltwater pulse 1A, sea level rose by about 1 foot per decade or about 100 feet in 1,000 years.
The point I am trying to make is that things change. So, let’s get back to Greenland. Greenland is covered by enormous sheets of ice. A huge amount of fresh water is locked up in Greenland’s ice. In fact, about 70 percent of all the fresh water on earth is locked up in glaciers and ice sheets (http://water.usgs. gov/edu/earthwherewater.html). Now for the first time in 100,000 years, the Greenland ice sheet is starting to melt. There are 20 feet of sea level rise just in the Greenland ice sheet. Melting of the Antarctic ice sheet would lead to about 212 feet of sea level rise, and it is also starting to melt.
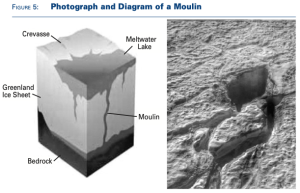
In Greenland, we flew over the ice sheet. The helicopter landed, and we got out and walked around. The photograph in Figure 5 shows a feature called a moulin, which is a big hole in the ice. The one in the photograph is about the size of a football field. Meltwater is flowing into the moulin. The diagram in Figure 4 shows an ice sheet with a moulin. The meltwater stream goes all the way down through two miles of ice to the bottom of the glacier. The water then creates a lubricating layer between the ice sheet and the ground, which accelerates the movement of the ice sheet toward the ocean.
The melting appears to be happening a lot faster than anyone had anticipated. I was at an Intelligence Committee meeting and they handed out a sheet of paper with pictures of the extent of the Arctic sea ice in 1980, 1990, 2000, 2010, and projected 2015 and 2030. While we were looking at this during the hearing, I used my cell phone and searched “Arctic sea ice” and found that the extent of Arctic sea ice today is less than they were projecting for 2030.
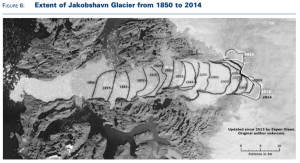
Figure 6 shows the Jakobshavn Glacier, the largest one in Greenland. Think of the ice sheet as a big hunk of ice and a glacier as a river of ice. Ice is flowing from the ice sheet down the glacier and heading out to the ocean. In this figure, the lines are dates of the glacier’s extent, that is, where the face of the glacier reached in the past. It has retreated as much in the last 12 years as it had in the previous 120 years. The face of the glacier is now actually in the ice sheet. The glacier is retreating 10 times as fast as it has historically.
When the ice leaves Greenland, the sea level goes up. When it leaves Antarctica, the sea level goes up. So I pressed John Englander and Bob Corell on the trip—and I’ve talked to other scientists since—what are we talking about? A couple of inches? Here’s what they said: A foot of sea level rise in the next 10 to 15 years and one foot per decade thereafter for the rest of the century. Has that ever happened before? Yes. It happened during the meltwater pulse 15,000 years ago.
A foot a decade is a catastrophe. It will be difficult for Maine; it will cost us a lot of money. But there are places where it will go beyond spending money, beyond aggravating: Miami and a good deal of Florida, New Orleans, which is already at or below sea level, all the major cities on the East Coast. Norfolk, Virginia, where we have most of our naval resources, is already seeing the effects of rising sea level.
The point I want to make is that this isn’t a feel good issue. This is practical, nuts-and-bolts protection of our country. If an enemy was coming who was planning to destroy Miami, wouldn’t we do something about it? Would we say, “Oh that’s okay, take it.” No, we would marshal all our resources to do something about it. Now in Miami they have sunny-day flooding, a flood of the streets in Miami and Miami Beach when there is no storm, no storm surge, no clouds, no rain. The water is just coming up through the stormwater drains. Florida is in particularly bad shape because the bedrock in Florida is porous limestone. It looks like swiss cheese. If you build a seawall on top of it, the water will come up from underneath.
There are other serious national security implications of climate change and sea level rise. The Joint Chiefs of Staff several years ago said that climate change was a serious national security issue. Part of the issue is the simple physical risk to our bases all over the world due to sea level rise. The other part of the problem is due to temperature. As temperatures go up around the world, particularly in the equatorial area, there will be regions that are no longer habitable. By the end of this century, we could see between 200 million and 1 billion people displaced. We will see hundreds of millions of people on the move because of a lack of water or the inability to raise food in the places in which they have lived. This displacement is a national security issue.
Figure 7 is a representation of summer sea ice in the Arctic Ocean. Sea ice extent was stable from the 1870s until about 1950, and then it starts to decrease dramatically. Another way to think about sea ice in the Arctic Ocean is by volume. From 1979 to 2015, the minimum volume of Arctic sea ice has decreased from 16,885 cubic kilometers to 5,670 cubic kilometers—a reduction of two-thirds of the volume of ice. The Arctic Ocean has been covered by ice throughout all of human history, mostly year round, but now it is melting, and we need to figure out what we’re going to do about it.3
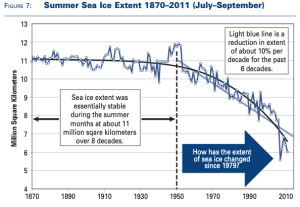
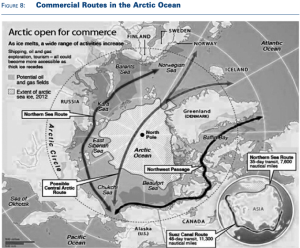
Figure 8 shows a view of the Arctic region with the North Pole in the center. Russia has the largest coastline along the Arctic Ocean, and the Northern Sea Route, the route that is clearest, passes along Russia’s coast. The Northwest Passage is along the coast of Alaska and Canada. It is not as navigable as the Northern Sea Route, but it is opening up.
The opening up of the Northwest Passage is an opportunity for Maine. Travel from Asia to the East Coast of the United States or Europe via the Arctic is much shorter than the routes through the Suez or Panama Canals. The state of Maine has the first ports on the East Coast for ships coming through the Northwest Passage, so this is important to us economically and strategically. The Arctic is important militarily because Russia is building military bases along its northern coast, and the region is also important for possible tourism (a luxury cruise ship sailed through the Northwest Passage this summer).
To address the issue of climate change, we have to come to some understanding about what is going on. I think you can learn everything you need to know about environmental and ecological policy from what I call the “Maine rototiller rule”: If you borrow your neighbor’s rototiller in the spring to till your garden, you give it back in as good shape as you got it, with a full tank of gas. We have the planet on loan. We don’t own it. We have it for a finite period. We are turning it over to our children and grandchildren and their children and grandchildren, and we don’t have the right to compromise it to the point where it will make their lives difficult if not impossible. I call it “intergenerational equity.” It’s our ethical and moral obligation to not ignore the results of what we’re doing.
Climate change is creating practical issues right now. It will affect us here in Maine and all over the country. I think we have an obligation to understand the facts and to formulate policies to address these issues. I’m not talking about radical policies that will destroy our quality of life, but rational policies that move us away from the combustion of fossil fuels, which add carbon to our atmosphere. We need to move in the direction of renewable energy sources and to make decisions in our personal lives that will help us deal with the problem of climate change. Unfortunately, scientists say it cannot be stopped. It’s too late. But we can slow it down and perhaps make it less horrendous than it would be otherwise. We also have to figure out how to cope with the effects of climate change and rising sea levels. How do we build things that will last for 100 years in the face of the effects of climate change?
There are no easy answers to the problem of climate change, but we have to continue to talk about it because it is one of the most serious issues we have ever faced.
I will end with two quotes: President Kennedy once said, “Our problems are man-made, therefore they may be solved by man.” And Winston Churchill: “You can always count on Americans to do the right thing — after they’ve tried everything else.”
If we can come to mutual understanding of the facts and obligations we have to the people who will live 100 years from now, we will find a way to do the right thing.
ENDNOTES
1 This essay and the accompanying figures are from Sen. King’s presentation at the Margaret Chase Smith Lectureship on Public Affairs, November 10, 2016, at the University
of Maine. If you would like to watch the actual presentation, it is available here (https://www.youtube.com/watch?v=pP8ELt4x-agA&feature=youtu.be).
2 This animation of spiraling global temperatures shows the pace of global temperature change in a visually appealing and straightforward way: http://blogs.reading.ac.uk/climate-lab-book/files/2016/05/spiral_optimized.gif NASA’s website also has interesting animations: https://svs.gsfc.nasa .gov/cgi-bin/details.cgiaid=4419
3 There are interesting animations that show what’s happening with Arctic sea ice: https://www.youtube.com/watch?v=Vj1G9gqhkYA and https://www.youtube.com/watch?v=H-BbPBg3vj8
Angus King was elected as Maine’s first Independent US senator in 2012. In the Senate, he serves as a member of the Armed Services, Energy and Natural Resources, Intelligence, Budget, and Rules Committees. He also served as governor of Maine from 1995 to 2003.
Citation: King, Angus. “Margaret Chase Smith Essay: Maine and Climate Change: The View from Greenland.” Maine Policy Review 25.2 (2016) : 8 -13, https://digitalcommons.library.umaine.edu/mpr/vol25/iss2/4.